Just to add to the idea of producing more useful and dare I say it, beautified, results that can be emailed from the unix server to the support team, this script produces a nice little bar chart of some oracle data.
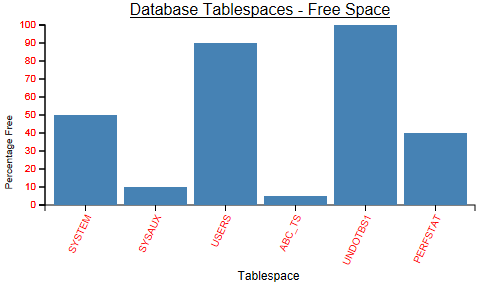
This one displays tablespaces and their percentage free.
It basically involves using HTML or SVG and the D3 javascript library (http://d3js.org/) which is open source. The script below consists of 3 sections. The first and last bits prepare the wrapper that formats the graph. The middle bit accesses sqlplus to retrieve the data in a predefined format.
There is so much you can do using this or other javascript libraries that the mind boggles. This one produces a result something like this.
It seemed while testing this, I was unable to have the output viewable straight from Outlook. So I’ve include the file as an attachment to the email.
#!/bin/sh
. $HOME/.profile 2>/dev/null
tmpfile=jhspace_`date +%d%b%Y`.html
cd /oracle/bmsusers/logs
rm ${tmpfile} 2>/dev/null
cat <<EOF1 >> ${tmpfile}
<!DOCTYPE html>
<meta charset="utf-8">
<style>
.chart rect {
fill: steelblue;
}
.chart text {
fill: red;
font: 10px sans-serif;
text-anchor: middle;
}
.axis text {
font: 10px sans-serif;
}
.axis path,
.axis line {
fill: none;
stroke: #000;
shape-rendering: crispEdges;
}
</style>
<svg class="chart"></svg>
<script src="http://d3js.org/d3.v3.min.js"></script>
<script>
var data = [
EOF1
#--------------------------------------------------------------------------------------------------------
sqlplus -s / as sysdba <<EOF >> ${tmpfile} set lin 400 set pages 1000 set feedback off set head off
SELECT '{name: "'||ts.tablespace_name||'", value: '||round((fr."FREE(MB)" / df."SIZE(MB)") * 100,2) || '},'
FROM (SELECT tablespace_name, SUM(bytes) / (1024 * 1024) "FREE(MB)"
FROM dba_free_space GROUP BY tablespace_name) fr,
(SELECT tablespace_name, SUM(bytes) / (1024 * 1024) "SIZE(MB)", COUNT(*) "File Count", SUM(maxbytes) / (1024 * 1024) "MAX_EXT"
FROM dba_data_files GROUP BY tablespace_name) df,
(SELECT tablespace_name
FROM dba_tablespaces) ts
WHERE fr.tablespace_name = df.tablespace_name (+)
AND fr.tablespace_name = ts.tablespace_name (+) ORDER BY (fr."FREE(MB)" / df."SIZE(MB)") * 100;
exit
EOF
#--------------------------------------------------------------------------------------------------------
cat <<EOF2 >> ${tmpfile}
];
var margin = {top: 40, right: 30, bottom: 100, left: 40},
width = 960 - margin.left - margin.right,
height = 500 - margin.top - margin.bottom;
var x = d3.scale.ordinal()
.rangeRoundBands([0, width], .1);
var y = d3.scale.linear()
.range([height, 0]);
var xAxis = d3.svg.axis()
.scale(x)
.orient("bottom");
var yAxis = d3.svg.axis()
.scale(y)
.orient("left");
var chart = d3.select(".chart")
.attr("width", width + margin.left + margin.right)
.attr("height", height + margin.top + margin.bottom)
.append("g")
.attr("transform", "translate(" + margin.left + "," + margin.top + ")");
x.domain(data.map(function(d) { return d.name; }));
y.domain([0, d3.max(data, function(d) { return d.value; })]);
chart.append("g")
.attr("class", "x axis")
.attr("transform", "translate(0," + height + ")")
.call(xAxis)
.selectAll("text")
.style("text-anchor", "end")
.attr("dx", "-.8em")
.attr("dy", ".15em")
.attr("transform", function(d) {
return "rotate(-65)"
});
chart.append("g")
.attr("class", "y axis")
.call(yAxis);
chart.selectAll(".bar")
.data(data)
.enter().append("rect")
.attr("class", "bar")
.attr("x", function(d) { return x(d.name); })
.attr("y", function(d) { return y(d.value); })
.attr("height", function(d) { return height - y(d.value); })
.attr("width", x.rangeBand());
chart.append("g")
.attr("class", "y axis")
.call(yAxis)
.append("text")
.attr("transform", "rotate(-90)")
.attr("y", -40)
.attr("x", -(height / 2))
.attr("dy", ".71em")
.style("font-size", "12px")
.style("fill", "black")
.style("text-anchor", "end")
.text("Percentage Free");
chart.append("g")
.attr("class", "x axis")
.append("text")
.attr("y", height + 75)
.attr("x", width / 2)
.attr("dx", ".71em")
.style("font-size", "12px")
.style("fill", "black")
.style("text-anchor", "middle")
.text("Tablespace");
chart.append("text")
.attr("x", (width / 2))
.attr("y", 0 - (margin.top / 2))
.attr("text-anchor", "middle")
.style("fill", "black")
.style("font-size", "16px")
.style("text-decoration", "underline")
.text("${ORACLE_SID} Tablespaces - Free Space");
</script>
EOF2
( cat <<HERE; uuencode "${tmpfile}" "${tmpfile}" ) | sendmail -oi -t
From: Production_DB
To: ${MY_EMAIL}
Subject: Database info $ORACLE_SID from cron job
HERE
echo Done
Happyjohn
No comments:
Post a Comment